At Meraki Analytics, we use data to tell stories. This dynamic visualization explores the fascinating trajectory of YouTube creator MrBeast, showing how persistence, experimentation, and compounding effects can lead to exponential success.
In data science, exponential growth is more than a mathematical concept; it is a story of compounding outcomes over time. In this visualization, which was made with the Wolfram Language, we capture one of the most striking real-world examples of that principle: MrBeast’s rise on YouTube from 2011 to 2025.
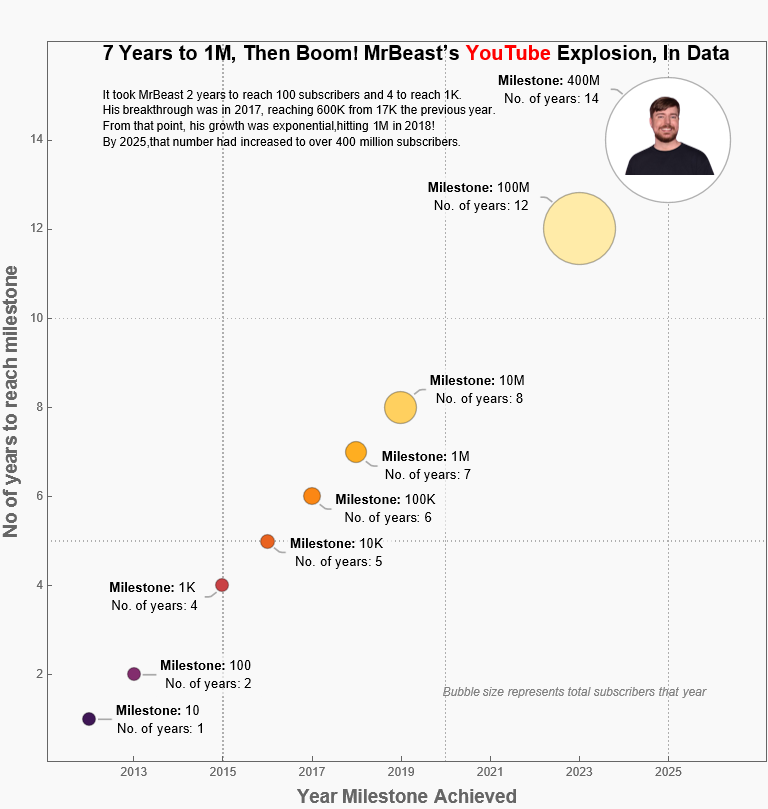
Each bubble represents a milestone year in MrBeast’s subscriber growth, with the bubble size scaled to total subscribers in that year. The x-axis shows the calendar year in which each milestone was achievedwhile the y-axis traces the number of years since his first video.
The visualization begins with small, almost imperceptible bubbles, symbolizing the early years when growth was linear and slow. Then, around 2017, the curve bends sharply upward. The bubbles grow dramatically, illustrating the onset of exponential acceleration, a shift typical of systems where compounding effects and network amplification converge.
A data perspective on growth phases
- 2011–2016: Low visibility, incremental learning, the “linear phase.
- 2017–2019: Inflection point, marked by viral content and audience feedback loops
- 2020–2025: Exponential scaling, characterized by global reach and platform dominance.
This trajectory mirrors the behavior of many complex growth systems, from startup scaling curves to epidemic spread models, where persistence through the flat part of the curve precedes rapid acceleration.
Beyond entertainment metrics, this dataset is a visual reminder that data often encodes human persistence. The early points on this chart are years of low traction, yet they form the foundation of later explosive growth.
In data terms, we might say that the system’s signal-to-noise ratio improved over time, with each experiment refining the algorithm of audience engagement until the underlying model began to scale.
The broader lesson
Exponential outcomes rarely emerge from sudden breakthroughs. They evolve from consistent iteration and feedback, the same principle that drives robust machine learning models, startups, and human progress itself.
This visualization is therefore not just about MrBeast. It is a case study in how long-term consistency creates nonlinear results.